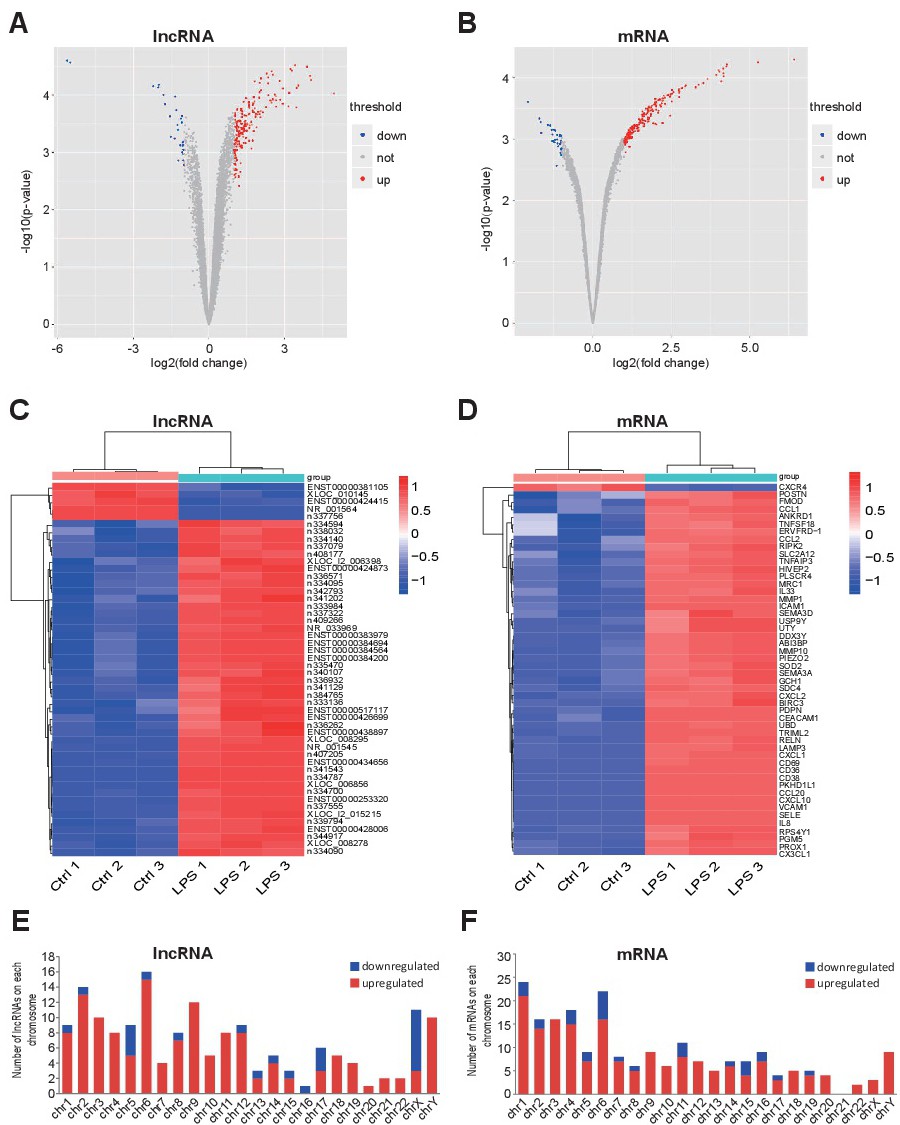
Fig. 1. Volcano plots, expression profiles and chromosome distribution of differentially expressed lncRNAs and mRNAs in HPMECs treated with LPS. Volcano plots of differentially expressed lncRNAs (A) and mRNAs (B). Gray dots indicate no change. Blue and red dots indicate significantly downregulated and upregulated lncRNAs and mRNAs, respectively. Hierarchical clustering indicates lncRNA (C) and mRNA (D) profiles. Red and blue columns refer to high and low relative expression, respectively. Distribution of differentially expressed lncRNAs (E) and mRNAs (F).